|
Yuri Engelhardt, Ph.D. data visualization information design information graphics graphics and digital media for social good |
|
|
About me I am passionate about using data visualization, information design and digital media for social and environmental causes – especially in areas such as education, health, civil rights, poverty reduction, sustainability, transparency, accountability, citizen engagement and data journalism. I love data-driven 'Graphics with a Cause'. I am an assistant professor and co–coordinator of the multidisciplinary data visualization curriculum at the University of Amsterdam. My CV is here. A visual impression of a few of my projects is here.
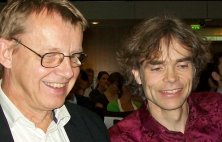
At the University of Amsterdam I am part of the New Media group, where we teach, supervise theses, research and visualize what is happening on the webmobile / social media. Having studied and taught data visualization for more than 20 years, I have, among other topics, been working on how visualizations use spatial positioning to convey meaning. My work is quoted by Colin Ware, Stuart Card, Jock Mackinlay, Ben Shneiderman and others. My concept of "meaningful space" in visual representations has been adopted by Dave Gray as a key principle of "Gamestorming". I have had the pleasure of presenting in many countries of the world, sharing the stage with Hans Rosling, Alberto Cairo, Manuel Lima, Lev Manovich, and many other 'visualizers'. Over the years I have greatly enjoyed my personal discussions with inspiring people such as Jacques Bertin, Nigel Holmes, Jorge Frascara, Richard Saul Wurman, Donald Norman, Stephen Few, etc.
I hold a Ph.D. in Computer Science (Department of Computational Linguistics, 2002), and an M.Sc. in Medicine (1990).
Coming up soon: The upcoming book 'About Information Design' includes my recent texts on 'Graphics with a Cause' and on the concept of 'Meaningful Space' as the quintessence of all graphics.
Master theses recently completed under my supervision: Data Journalism at the New York Times and the Guardian - by Marije Rooze The Flowing City – Visualizing Urban Data - by Margarida Fonseca Information Visualization and Participatory Culture - by Jan Bajec (see his related post on the Democratization of Data) Documentary Film and Data Visualization - by Ekaterina Yudin Google Earth's Contribution to the Climate Change Debate - by Xander Stolwijk
|
Contact me at: yuri.engelhardt (at) gmail (dot) com Recent activities
|
|
Moritz Stefaner about my Ph.D. work, The Language of Graphics: "I think it is a fantastic piece of work. [...] A great achievement [...] analytically really strong and I believe also quite novel in this form." Thank you, Moritz! Dave Gray calls it "the most thorough exploration and synthesis of visual grammatical forms I've ever seen." The book itself is out of print, but can be browsed and 'full-text-searched' here (a summary and some other information is here). My contributions to other books: Graphics – Neurath, Rosling, and the universal principles of visual representations (in print, 2012). Diagrams for the masses: Raising public awareness - from Neurath to Gapminder and Google Earth (with Raul Niño Zambrano). See here and here (first page also here). In: Diagrammatic representation and inference (2008). Network nations (with Ben Schouten) (scanned pdf). In: Else/Where (also here): Mapping – New cartographies of networks and territories (2006). Objects and spaces: The visual language of graphics. See here and here. In: Diagrammatic representation and inference (2006). A meta-taxonomy for diagram research (with Alan Blackwell). See here & here. In: Diagrammatic representation and reasoning (2002). Grundprinzipien grafischer Darstellungen. In: Navigation durch Text, Bild und Raum (2001). The other chapters are by Martin Krampen and other fellow speakers at "Forum Typografie 2000" in Hamburg, Germany. Meaningful space. In: If/Then: Design implications of new media (1999). Thanks to Google, see a few books that mention me / my work. Here are some (titles of) papers I have (co-)authored: Syntactic Structures in Graphics (pdf, 350 kB) (2007, also online). My critical review of Edward Tufte's Beautiful Evidence (2007). Meaningful space: How graphics use space to convey information (1998). A taxonomy of diagram taxonomies (1998). Structure-preserving visualization: Towards... (1997). Formal specification of a graphic design theory (1997) (with D. Wang and H. Zeevat). Towards a design theory for visualization(1996). The visual grammar of information graphics(1996). In this paper I examine how visualizations use spatial positioning to convey meaning. I propose a distinction between quantitative spatial axes and nominal/ordinal spatial axes. I discuss how these two types of spatial axes can be combined to construct complex visualizations (Tableau software has meanwhile done a wonderful job of implementing this principle). This paper is quoted by Colin Ware, Stuart Card, Jock Mackinlay, Ben Shneiderman, and others. |
My teaching Programs in which I have been lecturing include Media Studies, Human-Computer Interaction, Journalism, Graphic Design, Science Communication, and others. I have developed and taught a large number of courses at Bachelor, Master, Research Master, and Postgraduate levels - here is a selection of recent ones:
I have contributed as a curriculum developer and course instructor to the multidisciplinary bachelor's degree Future Planet Studies, which explores possible sustainable solutions for our current global challenges. And here are some BA courses in New Media that I have developed and taught in 2003-2006 (description in Dutch): New media analysis I, New media objects, Interaction design, Digital culture. Also, for many years now, I have been teaching Philosophy of Science, using collaborative visualization assignments and concept mapping. I am also a lecturer at the Utrecht Graduate School of Visual Art and Design (see my page there), where I am teaching: Information graphics in the MA program Editorial Design (also see here and here). Fifteen years ago, I co-taught Automatic visualization (1997) and Formal perspectives on visual representation (1996). Together with Juan Carlos Dürsteler (InfoVis) I have co-developed courses on information visualization for the Istituto Europeo di Design, for the Open University of Catalonia, and for the University Pompeu Fabra, Barcelona.
Presentations In addition to lecturing at universities, art academies, museums and other institutions and events in the Netherlands, I've enjoyed traveling to give presentations in, for example, Barcelona, Berlin, Cambridge (UK), Coventry, Edinburgh, Hamburg, Hannover, Ljubljana (Slovenia), London, Palo Alto (Stanford University), Paris (e.g. at the OECD, on 'Engaging Citizens with Animated Statistics'), Pittsburgh (Carnegie Mellon University), Rio de Janeiro (invited opening keynote), Recife (Brazil), Stockholm, ... |
|
Other work-related activities I am founder and was moderator (1995-1999) of InfoDesign and InfoDesign-Cafe, the first international online discussion forums about information design (see here and here). I am on the Advisory Committee of the Brazilian Journal of Information Design, and on the advisory board of IMAGE - Journal of Interdisciplinary Image Science. I was assistant curator of and contributor to the InfoArcadia exhibition (1999-2000) (more info). My memberships of program committees have included the 3rd Information Design International Conference and the Diagrams 2008 conference. I participated in a (somewhat lengthy) VizThink webcast discussion about visual language and visual grammar (also here). Together with Christian Behrens of 'Info Design Patterns' I prepared a session on '(De)-constructing Infographics' for VizThink Berlin, see "Yuri Engelhardt speaking at VizThink", 'The Building Blocks of Information Visualization', and '(De-)Constructing Information Visualization'.
|
Moving around ... My educational path has included elementary school in Australia, high school in Germany, college in California, and university in the Netherlands. I am a (close-to-) native speaker of English, German, and Dutch, and I also speak a bit of French and reasonable Spanish (which is continuously improving). So far my wife and I are raising our two young boys trilingually (Dutch, English, Spanish).
Some texts that others have written about my work:
Dutch media about my work:
English:
|


